In earlier years, one of the central issues of the Information Age was how one could properly harness the rapid production of content and curate it it in such a way that it could be commercialized. Then came social media; platforms like Facebook, Twitter, and Instagram have indeed come to define the modern citizen.
The competition among social media platforms has become a zero sum game, with an average of one and a half hours spent on social media per day. Even with user growth slowing, Facebook remains a dominant player. TikTok, which has grown rapidly is also starting to see user growth flatten out.
Facebook, as shown in figure 1, still has the largest share of eyeballs with over 70% of US households engaged with the platform. Furthermore Facebook users tend to spend a lot of time on the platform, with almost 60% spending at least an hour per day (see figure 2). We monitor social media usage with a wide range of questions asked to over 500 census-balanced respondents each day, and with three years of history.
TikTok has been growing in popularity, but, as shown in figure 3, over the last six months this growth has flattened out. At the current level of engagement the user base for TikTok is just over a third the size of Facebook, and this comes down to demographics.
As shown in figure 4, over 57% of Americans between 18 and 29 are users of TikTok, but under 7% of over 65 year olds use the app. In contrast, over 50% of both age groups are users of Facebook (74% of over 65 year old females, 59% of over 65 year old males, 64% of 18 to 29 year old females, and 51% of 18 to 29 year old males). In order to grow further, TikTok will need to appeal to a broader audience.
On the other hand, as shown in figure 5, users of TikTok spend more time on the platform than Facebook users, and advertisers care more about time spent and are particularly interested in the demographic profile of the age group that are TikTok users.
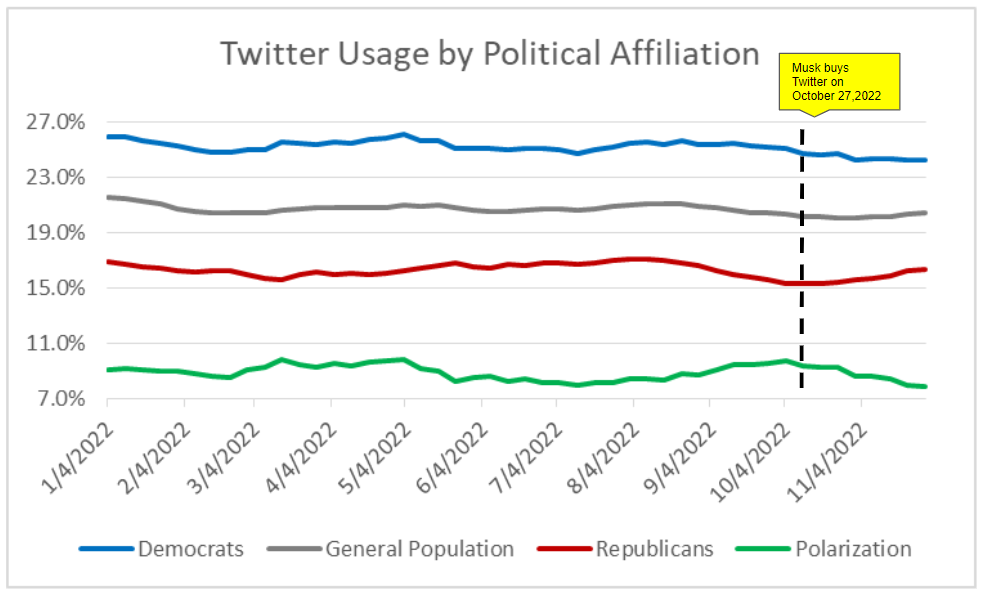
The demographics of Twitter users has been in the news since it was taken private by Elon Musk. Our data show that the percentage of respondents that are users of Twitter has not dropped in the last six months. The data also show, see figure 6, that the polarization of users between those indicating that they are registered Democrat and those who are registered Republican has decreased since it was taken private.
The other competition underway in social media is where to read the news. When given the chance to select multiple sources of news, a larger percentage of respondents identify Facebook as their source of news than any other individual source (see figure 7). Twitter is also growing in popularity as a source of news.
Social Media Platforms
1. It's Free And Better Stay That Way
Facebook maintains a towering lead over other platforms, with YouTube and TikTok interestingly ending up in the top five
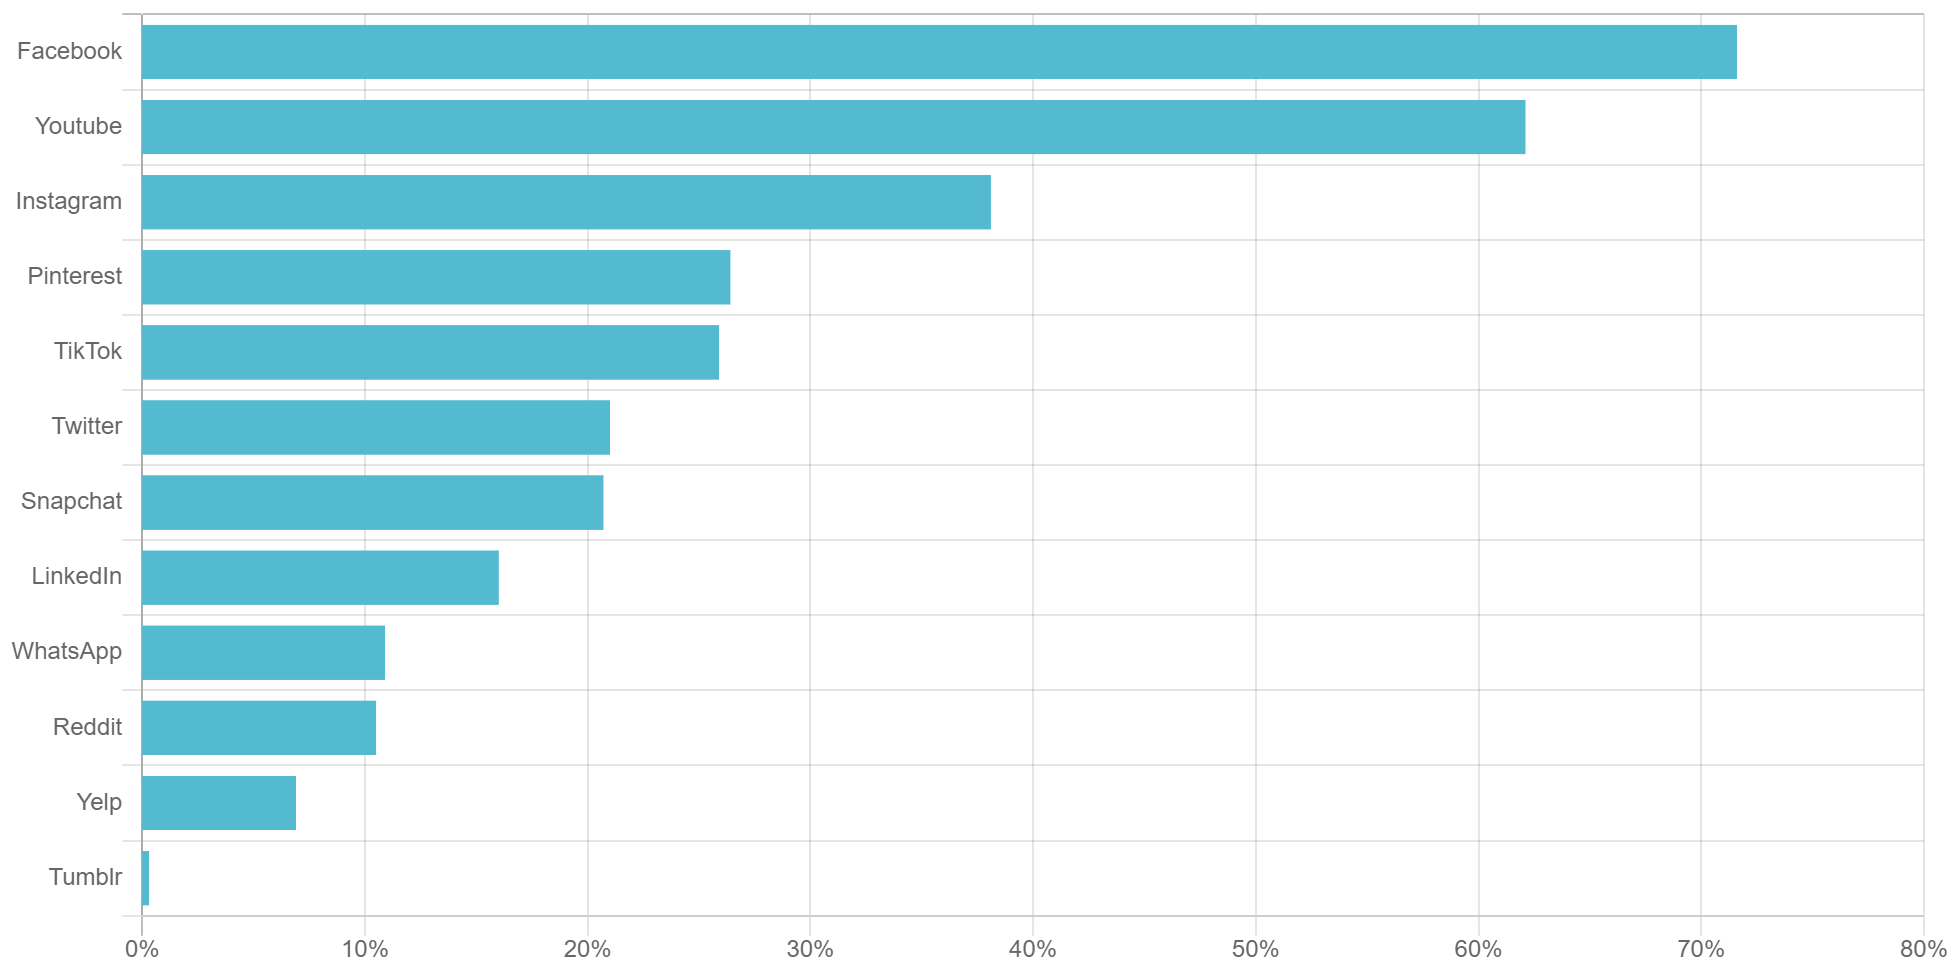
Social Media Users and Their Platform of Choice
2. Mark Twain Would Like A Word
Though the press has declared the death of Facebook, almost 60% of users spend at least an hour per day on Facebook
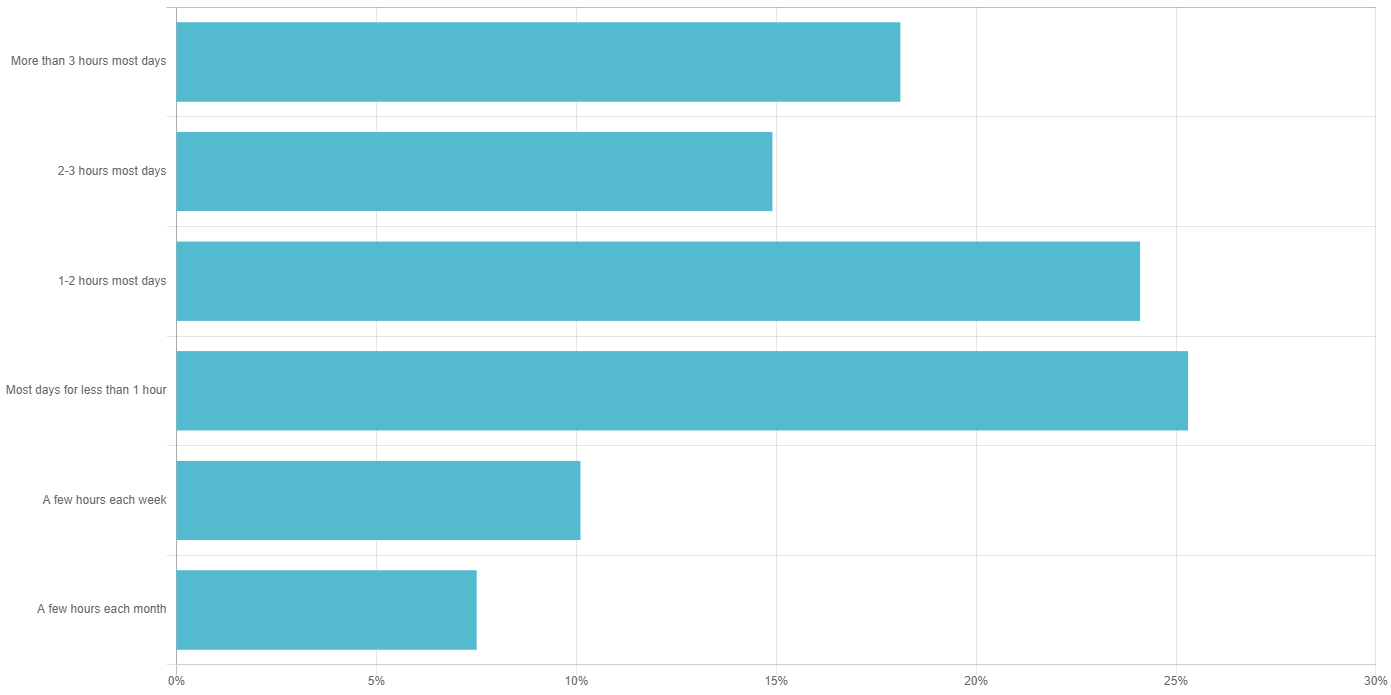
Time Spent on Facebook
TikTok
3. Dance Your Way To The Top
Thanks to the pandemic, TikTok has enjoyed a rapid ascent to become a formidable rival for other social media giants
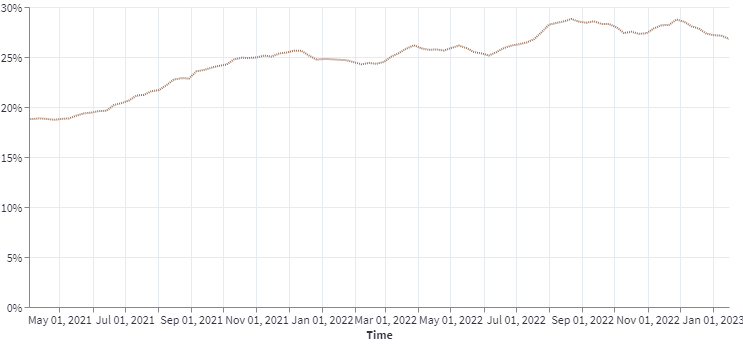
% of People That Use TikTok on a Regular Basis
Demographics
4. The Young vs the Many
While TikTok has come on to the social media scene quickly, it still skews overwhelmingly young and female
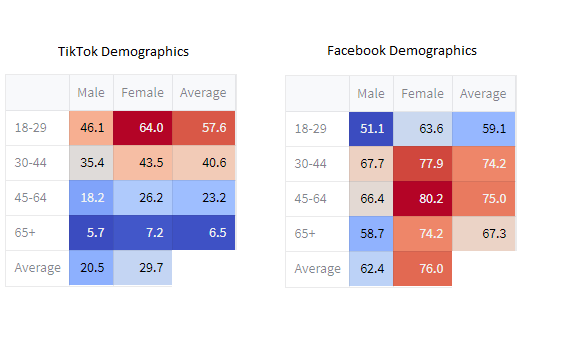
Age and Gender of TikTok and Facebook Users (%)
TikTok
5. FYP: The New Party Drug
1 out of 4 TikTok user spends over 3 hours per day on the platform
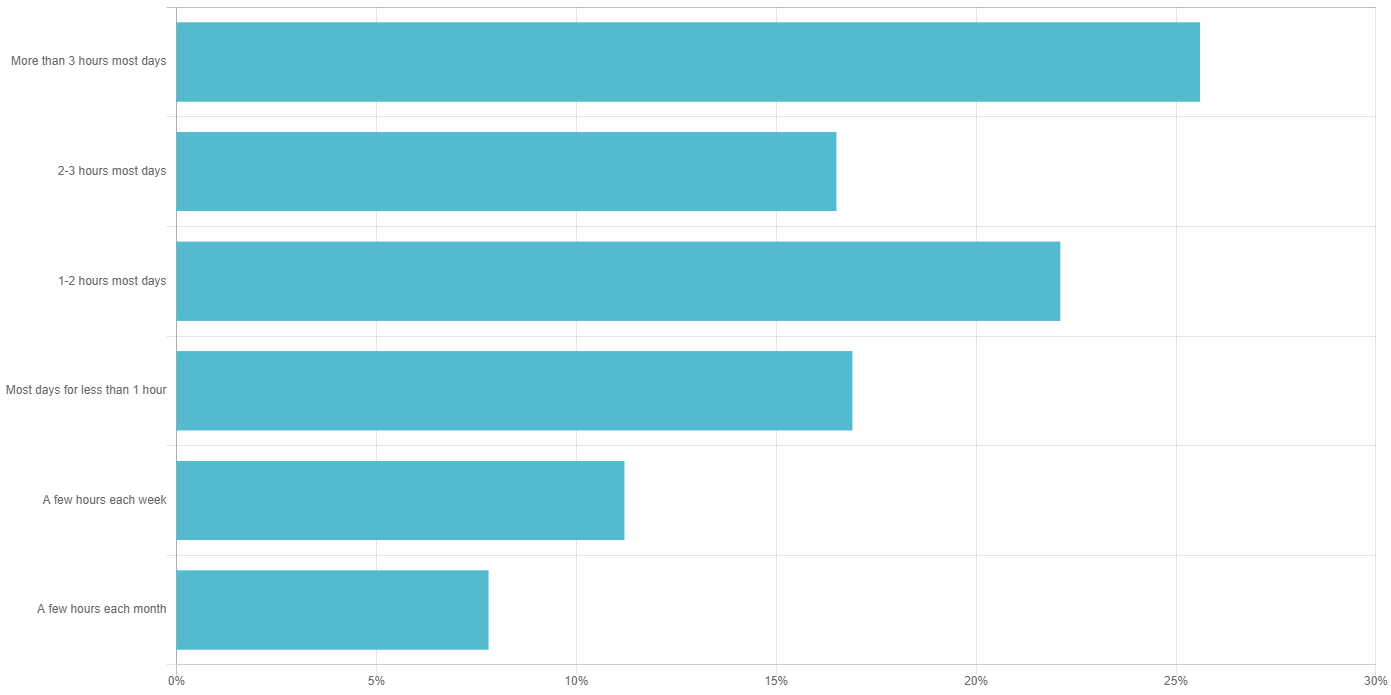
Time Spent on TikTok
6. Never Bend for the Algorithm
Polarization, defined by the spread of usage between Democrats and Republicans, is coming down
News Consumption
7. In These Times
Traditional television news outlets have tried to keep up with the Information Age, yet Facebook and Twitter remain their biggest rivals
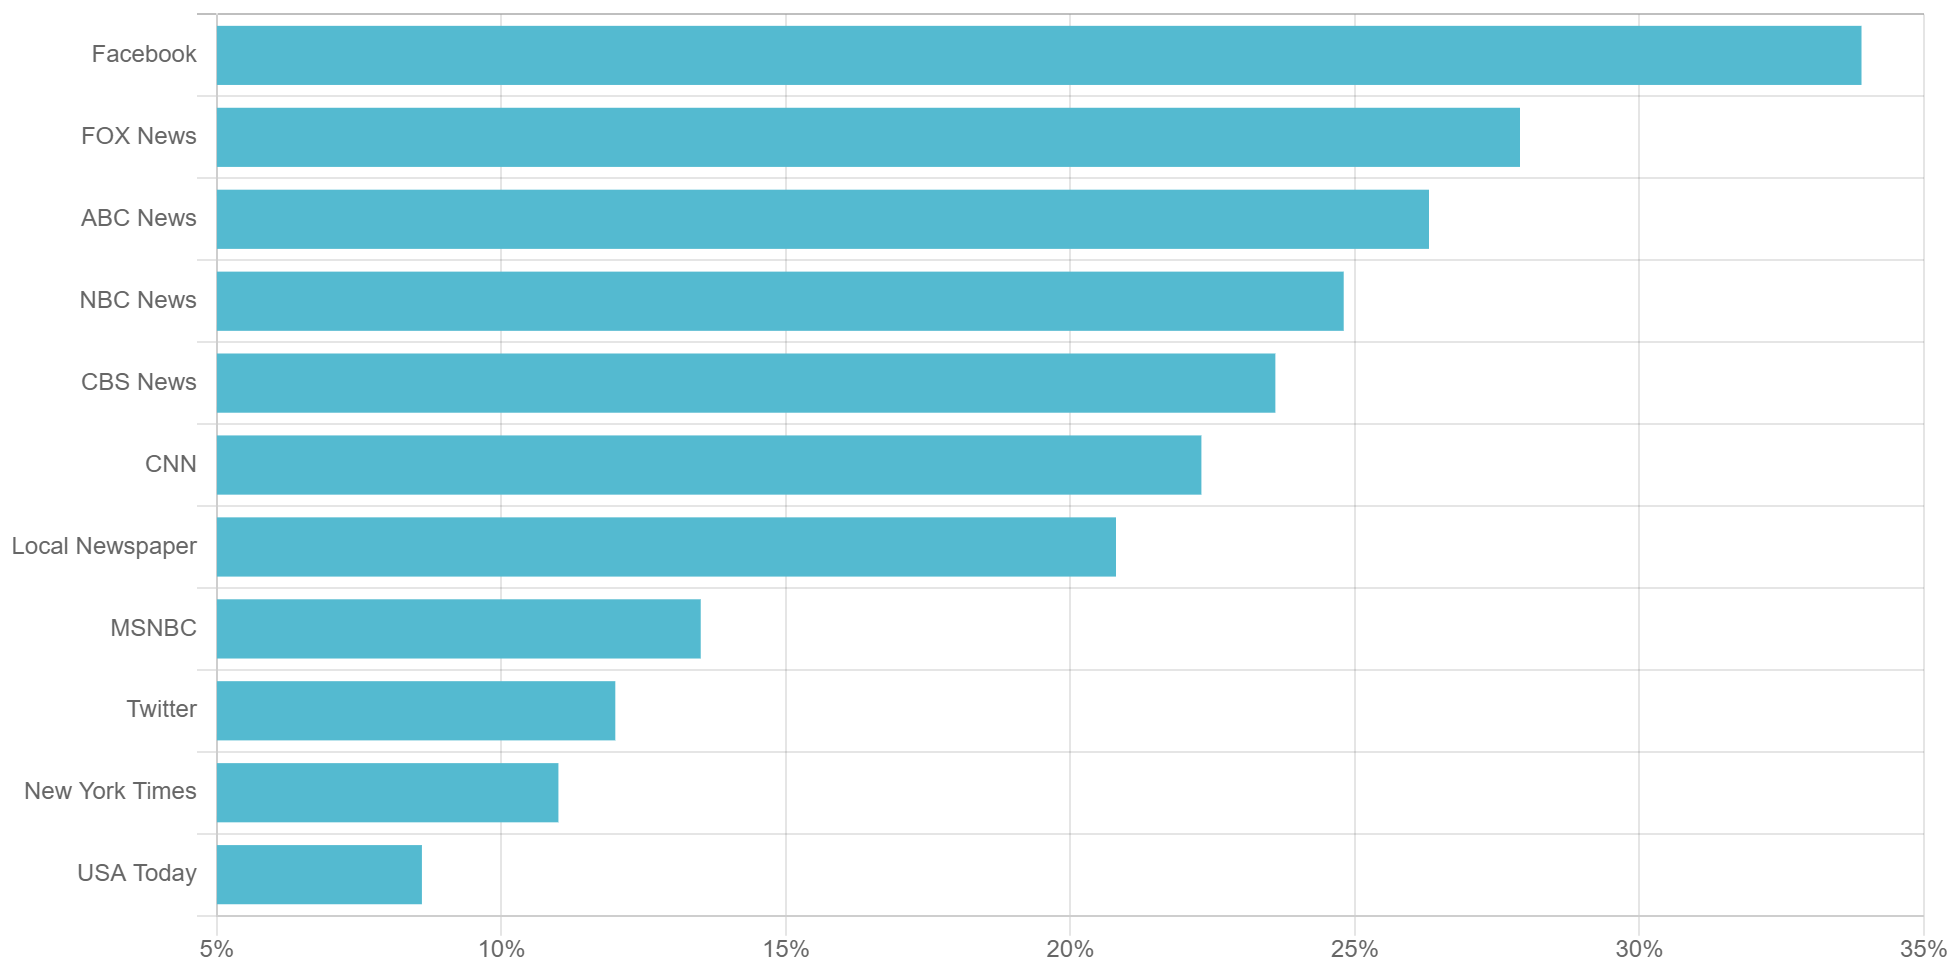
How Americans Get Their News
AlphaROC occam case studies are for illustrative purposes only. This material is not intended as a formal research report and should not be relied upon as a basis for making an investment decision. The firm, its employees, data vendors, and advisors may hold positions, including contrary positions, in companies discussed in these reports. It should not be assumed that any investments in securities, companies, sectors, or markets identified and described in these case studies will be profitable. Investors should consult with their advisors to determine the suitability of each investment based on their unique individual situation. Past performance is no guarantee of future results.