Building on the insights from “Decoding EV Demand: Battery-Powered Bubble,” this blog examines consumer brand preferences in the electric vehicle (EV) market. We analyze the year-over-year growth in consumer interest across EV brands, brand preferences by age and income, “cross-shopping intensity” by EV brand, and we examine the correlation between brand preferences for EVs in particular vs. overall brand preferences, irrespective of drivetrain. We also give special attention to Tesla, comparing its recent market share with Tesla purchase intentions and investigate the possibility of an emerging Tesla “fatigue” in western states with high Tesla penetration. We close with a brief examination of the burgeoning electric pickup truck market.
EV Purchase Intent Market Share
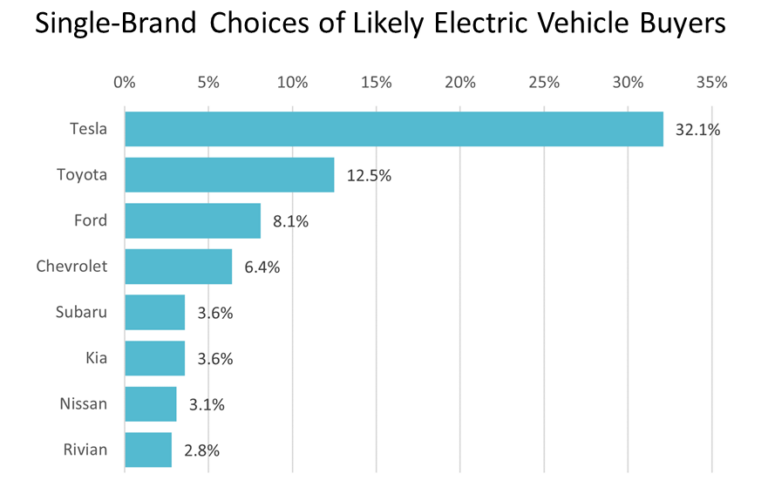
When EV shoppers are asked to choose only a single brand, Tesla emerges as the clear favorite, with 32.1% of respondents selecting it.
However, Tesla’s purchase intent “market share” of 32.1% lies meaningfully below its actual Q3 2023 market share of 50% (down from 62% market share from Q1). This gap (a “book-to-bill” of sorts) suggests to us that the decline in Tesla’s share of the EV market may continue at a non-negligible pace. Clearly, if Tesla were able to stem the decline in its EV share (possibly with the introduction of a mass market car) and the current rate of growth of the EV market were to persist, Tesla could still reach US unit sales competitive with the largest players.
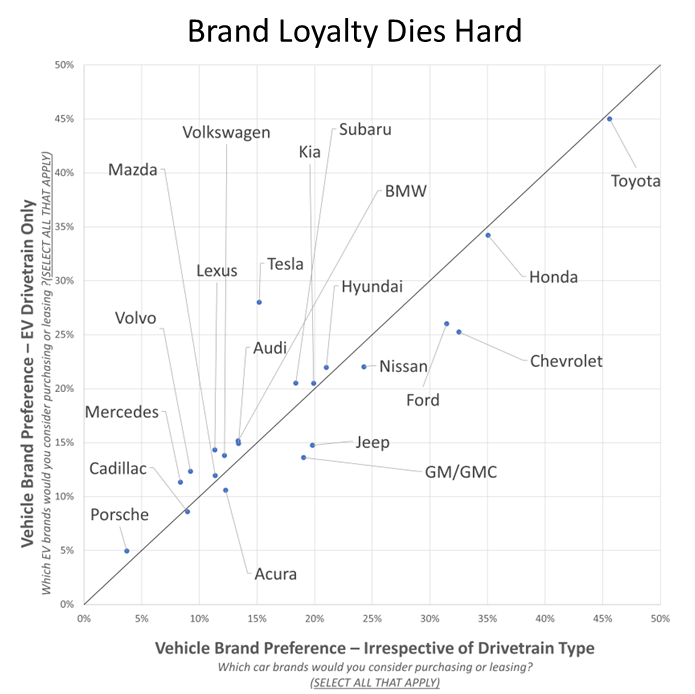
- When respondents are allowed to choose multiple brands that interest them, preference for EV brands strongly aligns with overall brand preferences (irrespective of drivetrain type). Honda and Toyota are a case in point – consumers show more interest in their EVs than any other brand, even though Honda does not have a single EV on the market (the Prologue is forthcoming), and though Toyota only has a single EV on the market, the BZ4X.
Cross-shopping EVs
All EV brands tracked by occam show an increase in consumer interest year-over-year. **
Polestar and Rivian, despite their smaller market shares, have experienced significant proportional increases in consumer interest.
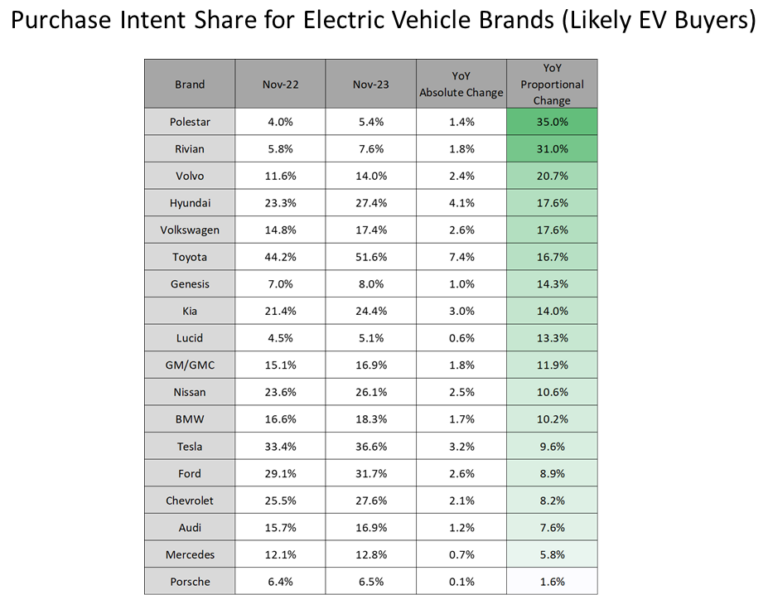
**Brands such as Honda, Subaru, Lexus, Jeep, Mazda, Acura, Cadillac, and Fisker were not tracked as of one year ago, therefore YoY figures are not available.
The table below shows which brands customers “cross-shop” when they are interested in the EV brand listed in the gray headers. Below the headers, the cross-shopped brands are listed in descending order of frequency.**
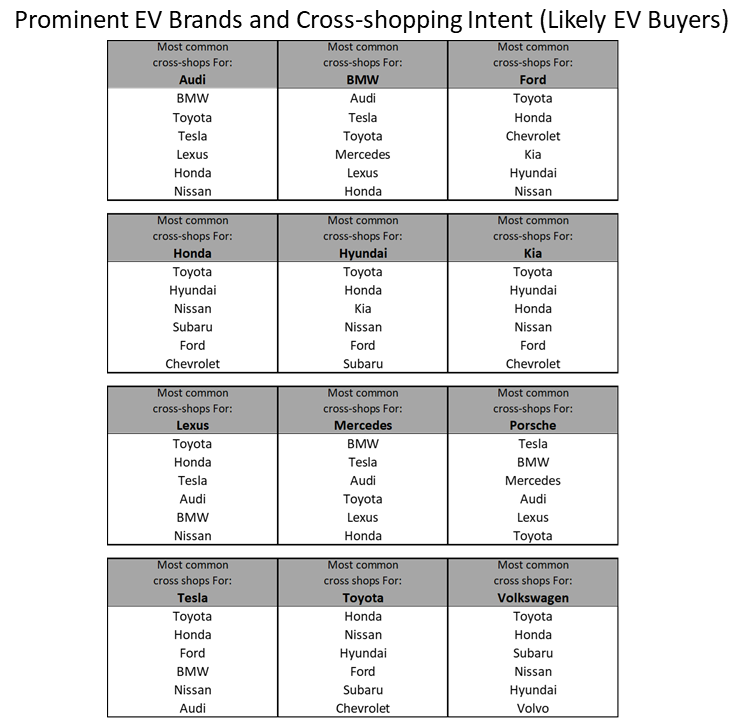
**Due to limited space, we feature here only 12 of the 26 EV brands tracked by occam. Interested in more? Create your account at occam.alpharoc.ai or contact us to schedule a demo!
Tesla Popularity
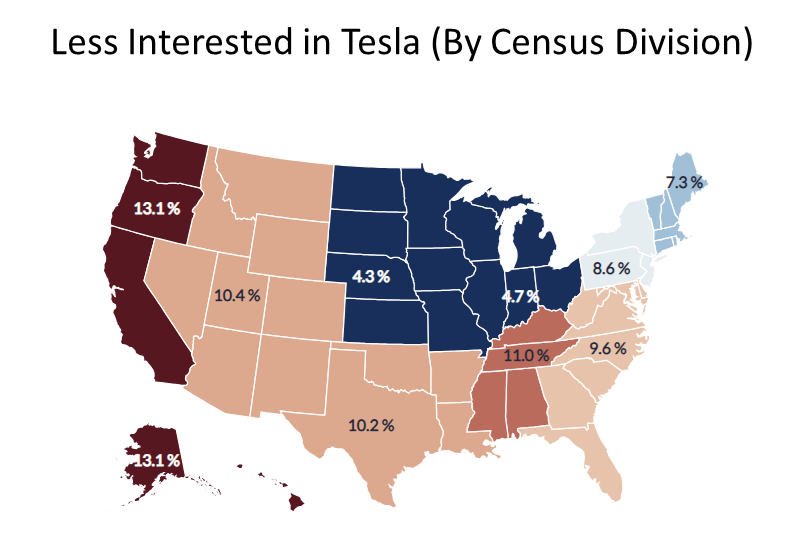
- The map below shows the percentage of respondents in each census division who say they have become less likely to buy a Tesla, because of the number of Teslas they see on the road. We suspect that it’s not by chance that the Pacific census division, which has the highest Tesla road presence, shows a high percentage of such respondents.
Cross-shopping EV Pickup Trucks
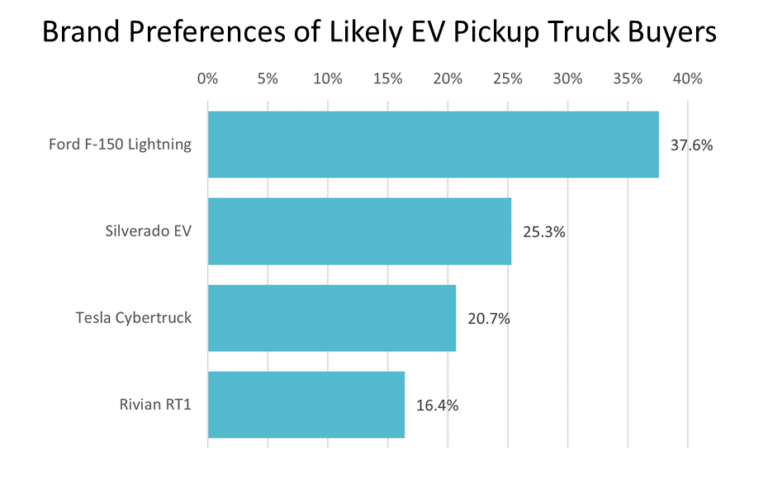
- Although the Tesla Cybertruck has garnered an outsized amount of media attention, consumer interest appears higher in competitors such as the F-150 Lightning and the upcoming Silverado EV.
- The F-150 Lightning, despite being in volume production for only a year, shows ample inventory – in fact, Ford is already offering an incentive on the Laredo trim; similarly, the Rivian R1T, even with its very limited production so far, has a surprisingly short waiting list.
- Considering that moderate/modest production of the F-150 Lightning and the Rivian R1T appears sufficient to meet demand, and given these two trucks rival the Cybertruck in consumer interest, we wonder what portion of the rumored two million Cybertruck reservations will be converted to sales.
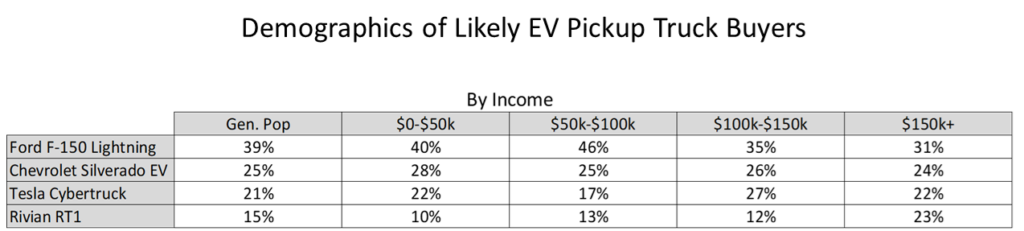
On a relative basis, the Rivian R1T skews most heavily towards the highest income cohort, while the F-150 Lightning skews more heavily towards more moderate income cohorts.
Source: Analysis based on occam™ proprietary AI-enhanced research platform with various data sources, including a wide range of questions asked to over 1000 respondents per day with over three years of history. Information is census-balanced and uses occam’s™ proprietary AI algorithm that ensures minimal sampling bias (<1%). Contact us for more info.
AlphaROC occam case studies are for illustrative purposes only. This material is not intended as a formal research report and should not be relied upon as a basis for making an investment decision. The firm, its employees, data vendors, and advisors may hold positions, including contrary positions, in companies discussed in these reports. It should not be assumed that any investments in securities, companies, sectors, or markets identified and described in these case studies will be profitable. Investors should consult with their advisors to determine the suitability of each investment based on their unique individual situation. Past performance is no guarantee of future results.